Radar Data
Independent investigators have received 2 sets of radar data from the NSTB as the result of Freedom of Information Act (FOIA) requests. The first one, received in 1999 covered the time period from 8:02 pm until 8:47pm. The second set, received in August 2001 and consisting of 2 CDs, covered an expanded time period from 8:02 to 8:27 and from 8:55 to 11:00 pm. Missing, with no explanation was the time period from 8:47 to 8:55. Following are links to the actual data and some explanation of the files, which is more than the NTSB gave us.Initial Radar Data Released in 1999
Raw Radar Data Files - Zip Format - Download and unzip on your own computer.
August 2001 Expanded Radar Data
Judge's Order and Certification of Data
Animation of Radar Data - 2010
Radar Analysis on Flight 800
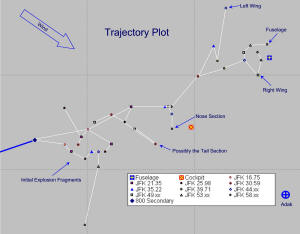
JFK Radar Analysis - Shows path of major fragments of Flight 800
 Islip Radar
Analysis - Shows missile impact & proves eyewitnesses did
not see "Flight 800 in various stages of crippled
flight". The eyewitnesses saw a missile!
Islip Radar
Analysis - Shows missile impact & proves eyewitnesses did
not see "Flight 800 in various stages of crippled
flight". The eyewitnesses saw a missile!
Radar of Additional Boats in the area of the crash of TWA Flight 800(16k pdf file) Speed in knots indicated on graphic
Letter to NTSB Chairman Hall - 2-19-00 html version of letter.
 Analysis
of NTSB Exhibit 22c - The recently released
radar data has been compared with the NTSB's trajectory study in
Exhibit 22c and a careful analysis shows that Exhibit 22c is
internally inconsistent. Two different graphs in Exhibit 22c show
widely different times for Flight 800 to be in the air. The
graph (figure 10) which shows the CIA/NTSB simulation of the
aircraft climbing (like a streaking missile) shows the aircraft was
airborne for more than 53 seconds. The graph (figure 18) which shows
the radar track from the Islip ASR-8 radar shows 9 radar hits which
equal 42.2 seconds. A careful sweep by sweep analysis of the
raw radar data has shown that there were only 8 radar hits which
equals 37.5 seconds. This leaves more than 15 seconds
unaccounted for. If the aircraft fell in a ballistic arc from
the initial explosion, it would have hit the water after 8 radar
sweeps. If the aircraft did a "zoom climb" as
postulated by the CIA and NTSB simulations, it would have been at
15,000 ft or 8,000 ft. after Sweep 8 and should have still been
visible on radar for another 16 seconds, or 3-4 radar sweeps.
It was not. Because it was already in the water.
Analysis
of NTSB Exhibit 22c - The recently released
radar data has been compared with the NTSB's trajectory study in
Exhibit 22c and a careful analysis shows that Exhibit 22c is
internally inconsistent. Two different graphs in Exhibit 22c show
widely different times for Flight 800 to be in the air. The
graph (figure 10) which shows the CIA/NTSB simulation of the
aircraft climbing (like a streaking missile) shows the aircraft was
airborne for more than 53 seconds. The graph (figure 18) which shows
the radar track from the Islip ASR-8 radar shows 9 radar hits which
equal 42.2 seconds. A careful sweep by sweep analysis of the
raw radar data has shown that there were only 8 radar hits which
equals 37.5 seconds. This leaves more than 15 seconds
unaccounted for. If the aircraft fell in a ballistic arc from
the initial explosion, it would have hit the water after 8 radar
sweeps. If the aircraft did a "zoom climb" as
postulated by the CIA and NTSB simulations, it would have been at
15,000 ft or 8,000 ft. after Sweep 8 and should have still been
visible on radar for another 16 seconds, or 3-4 radar sweeps.
It was not. Because it was already in the water.
Analysis of Exhibit 22c in gif format. Page 1, Page 2. Added 2-17-00
E-Mail to Dennis Crider - NTSB - Questions about Exhibit 22c anomalies
Response from Bernard Loeb - NTSB - Director of Aviation Safety